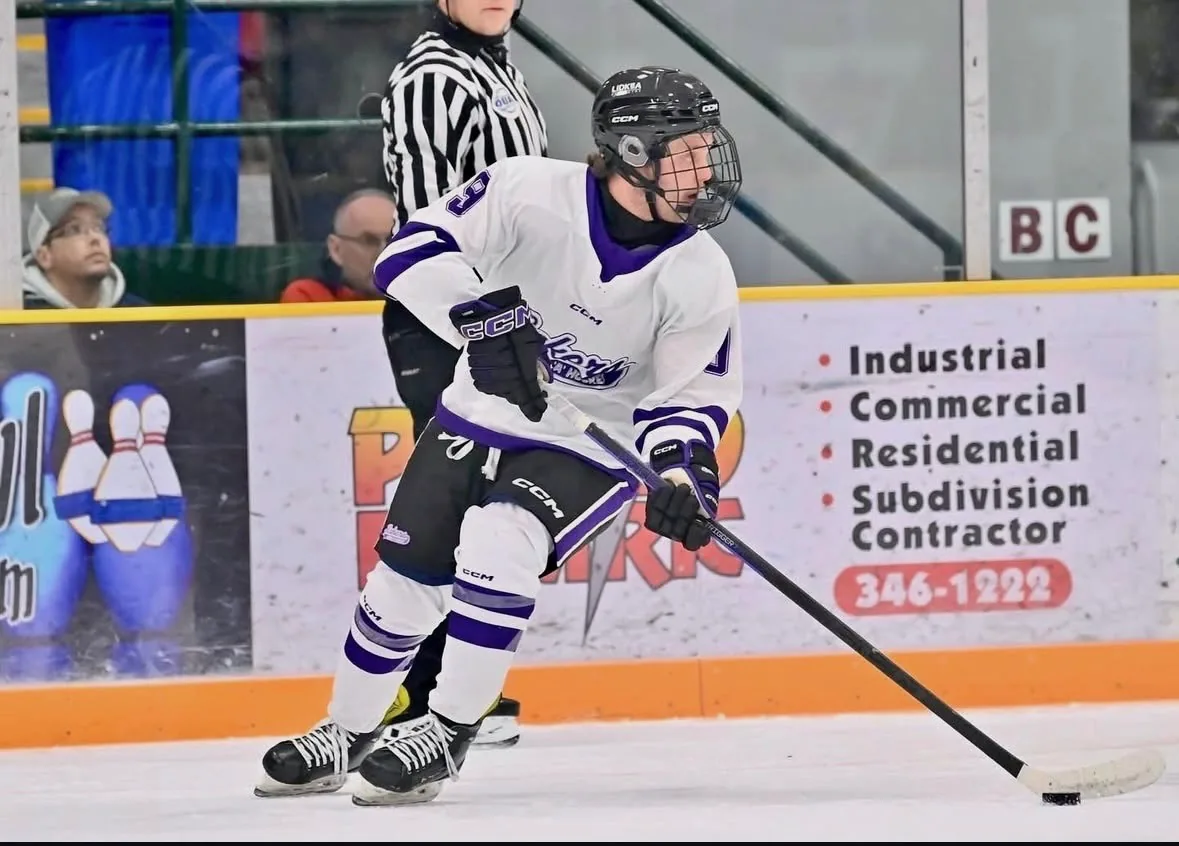
Two athletes, both 181 pounds, same sport demands, walked in for the same baseline assessment. On a roster sheet they are the same line. The numbers said they needed almost nothing in common — and a few weeks later, one of them proved exactly why that matters.
Real player. Real athlete. Real results. This is a real breakdown of two FPC athletes. One is Tie Schumacher — a Coeur d'Alene high schooler and his league's Forward of the Year. The other we'll keep anonymous as R. Here's how "individualized, always" looks in practice instead of theory.
Maximal Strength
- Back Squat 1RM
- 245 lb
- Bench Press 1RM
- 185 lb
- Squat : Bodyweight
- 1.35
- Chin-Up Standard
- 5 reps
- Back Squat 1RM
- 185 lb
- Bench Press 1RM
- 135 lb
- Squat : Bodyweight
- 1.02
- Chin-Up Standard
- 3 reps
60 lb apart on the squat at the same bodyweight. Tie's Relative Strength Ratio sits at 1.19. R.'s sits at 0.89 — well below the 1.35 threshold we build toward. On paper they could look like the same athlete. They are not.
Power & Change of Direction
- EUR (CMJ ÷ SJ)
- 1.27
- 5-0-5 Left
- 2.48 s
- 5-0-5 Right
- 2.41 s
- L / R Asymmetry
- 2.9% left deficit
- EUR (CMJ ÷ SJ)
- 1.25
- 5-0-5 Left
- 2.32 s
- 5-0-5 Right
- 2.31 s
- L / R Asymmetry
- 0.4% — symmetric
R. is faster through change of direction despite being weaker. That is not a contradiction — it is a flag. R.'s side plank shows a 41% left-side deficit, a compensation the 5-0-5 isn't catching yet. Left unaddressed, that gap surfaces under fatigue.
The Shared Pattern
Both athletes reported right upper-glute pain. Neither one connected it to anything. That is exactly the kind of thing a movement assessment catches and a workout never would.
Same-side presentation in two unrelated athletes is a flag worth investigating, not a coincidence to ignore. Both were held from heavy hip-hinge loading until it's properly screened.
Two athletes can share a bodyweight, a sport, and a symptom — and still need two different plans.
Where the Programs Split
Then Tie Proved It
Tie's program was built off a hypertrophy need — not a max-strength push. The strength came as a byproduct of training the right thing. In 8 weeks — from his initial assessment on May 12, 2026 to his re-test on July 10, 2026 — here's where he moved:
His Relative Strength Ratio climbed from 1.19 to roughly 1.49 — clearing the 1.35 threshold that defined the entire first phase of his program, in a single 8-week block (May 12 → July 10, 2026). Program the actual need and the numbers you weren't even chasing come with it.
Assessed, Not Assumed
This is the whole argument for how FPC operates. We don't hand out a program. We run the athlete through a real screen — strength, power, change of direction, asymmetry, movement, and pain history — and let the data decide where the ceiling actually is. Two athletes who look identical on a roster can need almost opposite things, and you will never see it by watching them warm up. You have to test.
Same bodyweight. Same sport. Same symptom. Two blueprints that shared little beyond a phase and a pending screen. One of them just proved why that mattered.
The most expensive mistake in athletic development is a good program pointed at the wrong problem. The assessment is what keeps the arrow honest.
Start With a Free 45-Minute Consultation.
Start with a free 45-minute consultation about your goals, current training, and what is not improving. If FPC is the right fit, Cody will explain the assessment and next steps.
Book a Free 45-Minute Consultation →